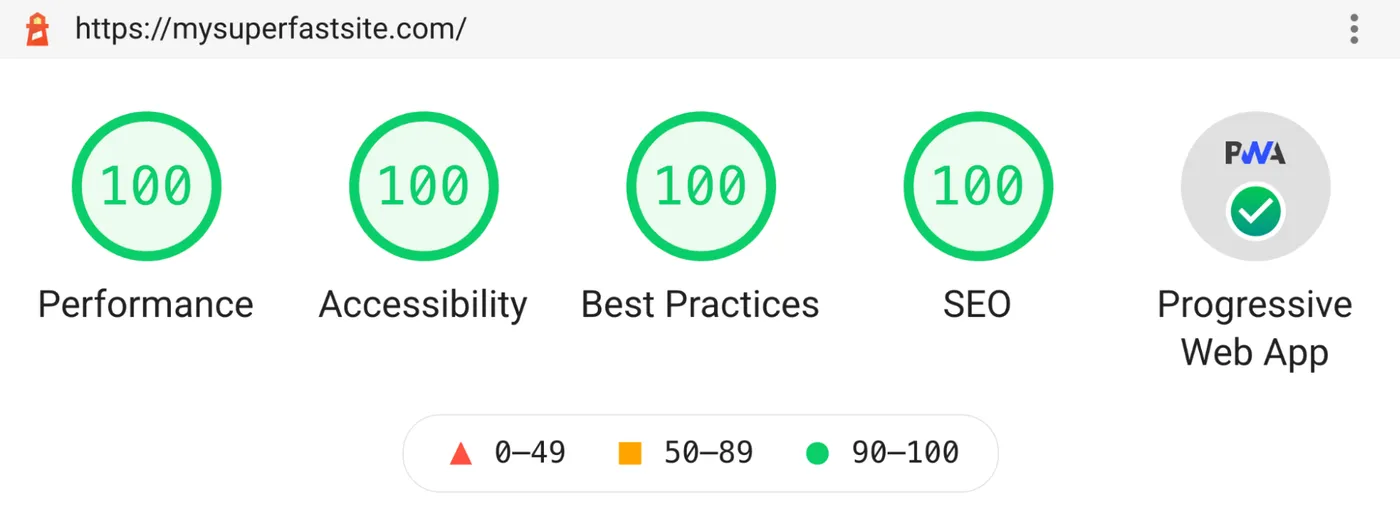
I have noticed a trend in recent years—a trend that I’ve admittedly been part of myself—where performance-minded developers will rebuild a site and then post a screenshot of their Lighthouse score on social media to show off how fast it is.
What might come as a surprise to many of the people reading this post is that I kinda want this trend to stop—or at least, I want it to change.
Now, let me be perfectly clear: there is absolutely nothing wrong with bragging about your success on social media, and there’s also nothing wrong with using Lighthouse or striving to get a good Lighthouse score.
What concerns me about this practice is that it glosses over a lot of important nuance, and it perpetuates the idea that synthetic or lab-based tools (like Lighthouse, WebPageTest, and many others) are genuine and precise assessments of a site’s actual, real-world performance—rather than what they are: tools to test, debug, diagnose, optimize, and predict performance or detect regressions under a set of controlled conditions.
To put that another way, getting a 100 on Lighthouse is definitely a very good sign, but it doesn’t guarantee that your site will be totally free of any performance issues in the real world.
In fact, my colleague Brendan Kenny just published some research that analyzed all the pages in the HTTP Archive corpus and looked at whether there’s a correlation between Lighthouse scores and Core Web Vitals scores based on field data (a.k.a. real-user or RUM data) from the Chrome User Experience Report (CrUX). The results did find a strong, positive correlation between the two, but it also found something pretty surprising to me:
Almost half of all pages that scored 100 on Lighthouse didn’t meet the recommended Core Web Vitals thresholds.
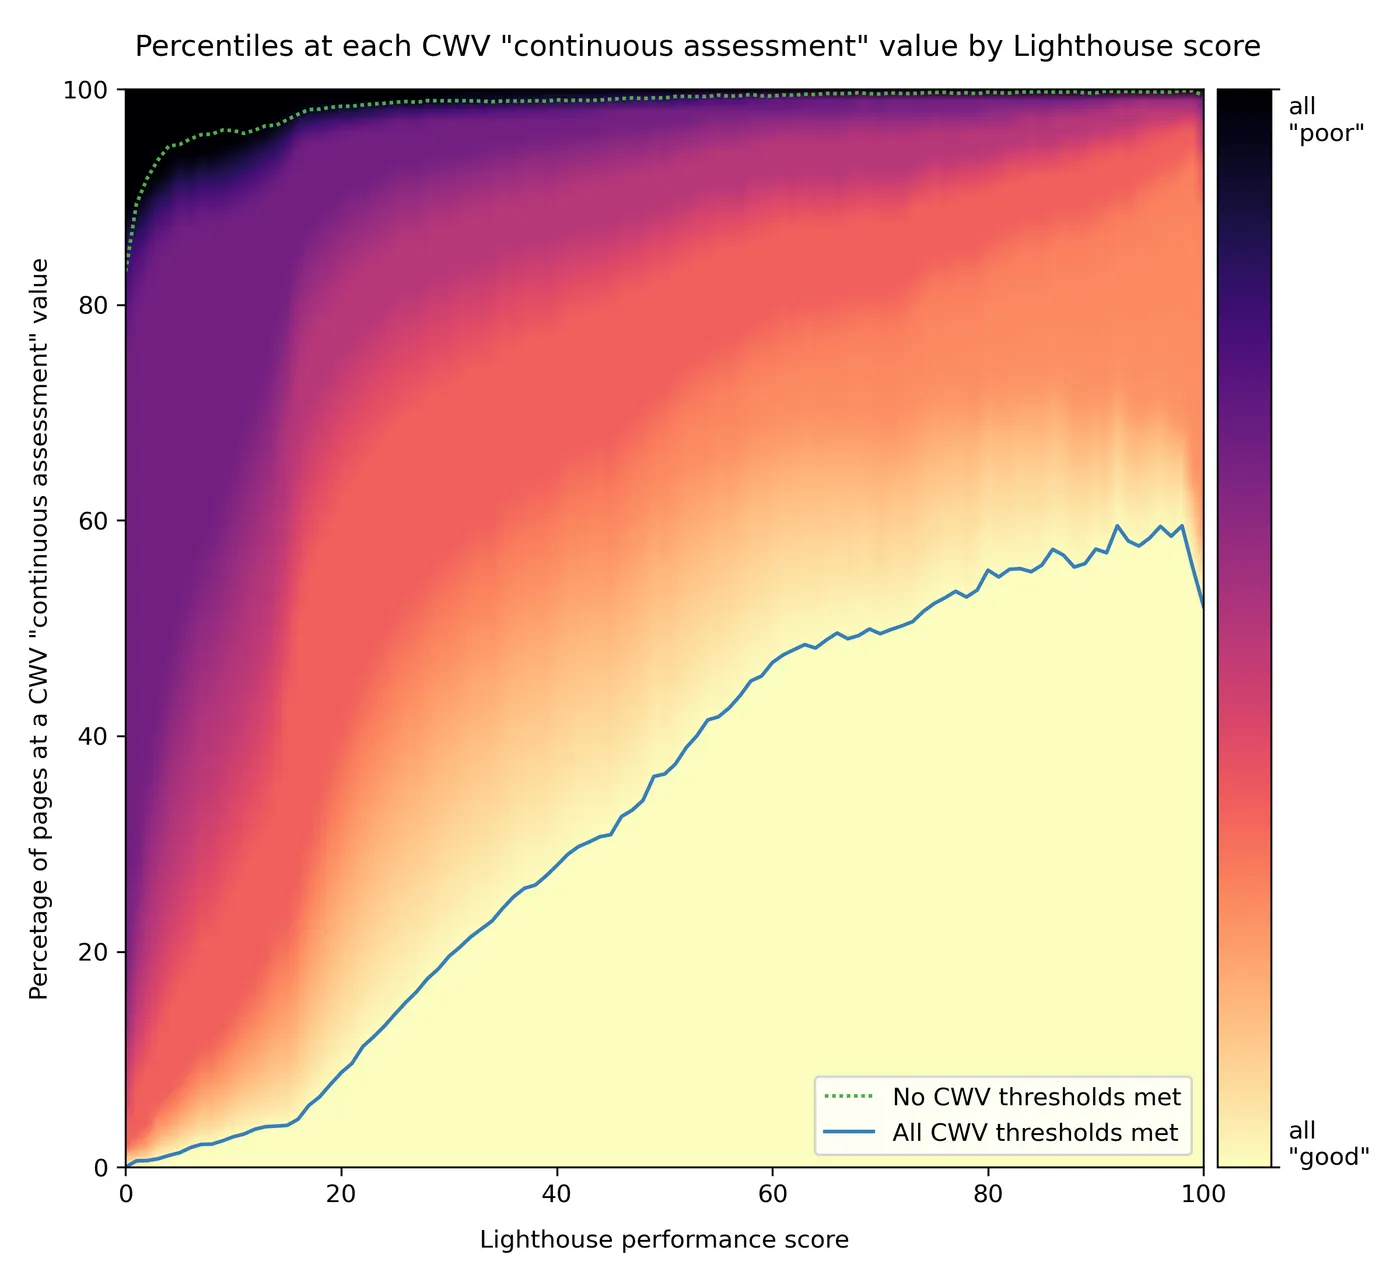
I’ve always known it was possible to get a 100 on Lighthouse yet still have real-world issues, but I wouldn’t have guessed it was this common. Incidentally, the data also shows that the reverse is common too: many pages that fully meet all the Core Web Vitals thresholds actually have very poor Lighthouse scores.
Now, just because a page doesn’t meet all of the recommended Core Web Vitals thresholds does not necessarily mean it’s terrible. The graph above includes a gradient from yellow to black that represents how close the pages with a particular Lighthouse score are to meeting all of the Core Web Vitals “good” thresholds. The amount of orange and red present for pages with 90+ Lighthouse scores does indicate that many of them were not far off. Nonetheless, the fact that so many pages with perfect Lighthouse scores still do see real-user performance issues is a clear indicator that lab tools have blind spots.
If you’re a performance expert, you’re probably aware of these blind spots, along with the myriad of other reasons why lab results can be different from real-user data (e.g. lab tools don’t account for scrolling or other user interaction, lab tools stop measuring after page load, and many, many other reasons), and you might assume that most developers understand these nuances too, but I can assure you that is definitely not the case.
In my experience working on the Web Vitals initiative at Google, the number one issue we hear from the community—by far—is confusion around why the numbers that they see in one tool don’t match the numbers they see in another tool, and in most of these cases the reason is because one tool reports lab data and the other reports field data.
Of course, performance is a complex topic, and it’s perfectly understandable that some confusion exists. But when I really step back and think about why there’s so much confusion, I just keep coming back to what I touched on above: the way people talk about performance publicly and on social media.
How we talk about performance
If you’ve spent much time in the web performance space, either at conferences, reading case studies, or just browsing Twitter, you’ve probably heard some variation of the following claims over and over again:
- My site loads in less than 1 second!
- Our home page gets interactive in under 5 seconds on 3G!
- We switched from technology A to technology B, and our LCP improved by 40%!
People make these kinds of claims because they’re short, sweet, and they sound really impressive. But unfortunately they’re also essentially meaningless without additional context.
For example, if someone were to say to me “My site loads in less than 1 second”, I would probably reply:
- For whom? Did it load in less than 1 second for every single person who visited it?
- When are you talking about? Does it load in less than 1 second now, or has it always loaded in less than 1 second for its entire existence?
- What does “load” mean? Are you talking about the literal load event, or are you using some other metric?
Now, normally I wouldn’t care if someone cited a meaningless stat online (I try not to be this guy), but recently it’s started to become clear just how many people think of performance this way—as a single number rather than a distribution of values (representing distinct user visits) that vary and fluctuate from day to day.
Another big problem with these types of claims (and this gets back to my earlier point about Lighthouse score bragging) is that more often than not they’re based on lab results and not real-user data.
Again, there’s absolutely nothing wrong with using lab-based tools to optimize performance. I use both Lighthouse and WebPageTest all the time before deploying changes to production. But I do think it’s problematic to imply (especially publicly) that lab-based performance results are in fact equivalent to real-world performance results. And I’m not just saying this to nit-pick technical details, I’m saying this because every single day I see people who are confused. They’re new to this industry and they don’t fully understand that there’s a difference between lab and field measurement, yet based on how much they see people talking about Lighthouse online, they assume it’s what industry experts use, but that’s not entirely true.
Through my work at Google and as a member of the W3C Web Performance Working Group, I get to see how engineers at some of the world’s most sophisticated companies measure and optimize performance, and basically all of these companies prioritize real-world data, and they make performance decisions based on real-user outcomes. To be clear, these companies also use lab-based tools to test, debug, diagnose, and optimize performance, but any decisions based on lab tests are always validated in the real world—typically via an experiment enabled on just a small percentage of users followed by a gradual rollout to all users only after the experiment has shown to be successful.
I understand that many companies don’t have the resources to build their own performance monitoring and experimentation infrastructure, but real-user performance monitoring isn’t something you have to build yourself. There are a number of fantastic RUM analytics solutions available on the market (some of them even free), so it’s a bit surprising to me how many companies still only look at lab data.
I think the problem we have as an industry is not one of access to real-user data, it’s one of awareness of the fact that lab data and field data are different. They serve different purposes, and these differences are actually useful and complementary.
But when we talk about lab data as if it’s equivalent to (or a substitute for) real-user data, I think we just exacerbate the misunderstanding, and in some cases gives people a false sense of security.
My challenge
My hope with this post is that I’ve convinced you that how we talk about performance actually does matter. The more we simplify and cover up the nuance in front of beginners, the more we confuse them and perpetuate the myths and misconceptions I discussed above.
So, in the spirit of helping raise awareness of the complexities of performance in the web development community, I want to offer this challenge to anyone speaking, writing, vlogging, or bragging about performance publicly:
- If you're going to talk about the performance of a production site, use real-user data.
If you haven't instrumented your site to collect real-user data, I've included some links below to help you get started. For sites with enough traffic to be in the CrUX dataset, you can use tools like PageSpeed Insights field data report or CrUX Dashboard to see real-user performance metrics based on Chrome telemetry.
- If you're going to use a single number to cite a performance result, specify where that number falls in the distribution.
For example, median server response times were XX milliseconds, or FCP at the 75th percentile was X seconds.
- When talking about real-user performance, be specific about the time period.
For example: "Over the past 7 days my median TTFB improved by 25% compared to the previous 7-day period". Specifying a time period helps emphasize that performance isn't a single number (and that it can change).
- If you do want to brag about your Lighthouse score or other lab results, do so in the context of the larger performance story.
For example: "We improved our Lighthouse score on our staging server from 62 to 95, and after deployment our 75th percentile LCP dropped from 5 seconds to 2.2!" Or at minimum if you don't have field data: "This technique improved image load performance by 40% in lab tests. We expect to see good results when we deploy it to real users next week!"
The above guidelines are admittedly subtle, but if enough people follow them, I do think it will have a big effect. Performance optimization should be about making your users happy, not about making your tools happy. And if we really believe that, we should lead by example.
Lastly, I just want to say that I definitely recognize real-user performance measurement is a lot harder than lab performance measurement. I know it’s more complicated to set up, it takes longer to get results (hours or days instead of seconds), and most RUM analytics products cost money to use.
When I talk to developers and ask them why they’re not using RUM, one response I often get is: I don’t think we need it. Our performance is really good. We monitor several key metrics on CI, and we have automated tests to ensure PRs don’t cause regressions.
If this is true, that’s absolutely fantastic! This is exactly what lab-based tools are meant for, and it’s where they provide the most value. But keep in mind the stat I cited at the beginning of this post: almost half of all pages in the HTTP Archive dataset that scored a 100 on Lighthouse did not meet the recommended Core Web Vitals thresholds based on real-user data.
So when you say you don’t need field data because your performance is already really good, you should ask yourself: how do you know if that’s actually true?
Additional resources
RUM analytics providers and services
The following companies all offer RUM analytics services. While I haven’t used all of these tools personally, I have met with all of these teams, and I’ve worked with companies that use their services.
- Cloudflare Insights
- Akamai mPulse
- SpeedCurve
- Blue Triangle
- Datadog
- Catchpoint Real User Monitoring
- Sentry Performance Monitoring
General guidance for measuring performance in the field
A list of resources I’ve written recently geared toward helping people measure performance using a general-purpose analytics tool or a tool they built themselves. While these all primarily discuss Web Vitals, the concepts do apply to general performance measurement as well.