Performant A/B testing has sort of been the white whale of the web performance industry for a number of years now.
While most teams I talk to would love to be able to run A/B tests to accurately assess the performance impact of certain changes, the problem is pretty much every popular A/B testing tool on the market has such a negative impact on load performance that they’re essentially unusable for this purpose.
If you’re just trying to determine which of two marketing headlines converts better, then perhaps this performance difference isn’t so bad. But if you’re wanting to run an A/B test to determine whether inlining your CSS in the <head> of your pages will improve your FCP, well, those popular A/B testing tools are just not going to cut it.
The problem with the current A/B testing tools is they construct the test on the client. They block rendering until they can determine which experiment group the current user should be in, and then they update the DOM based on that experiment’s parameters. On slow connections or low-end devices, this can mean users are staring at a blank screen for seconds waiting for network requests to finish before rendering can even start.
I’m aware that most of these tools do offer a server-side option as well, but even server-side A/B testing is not ideal because it still requires all page requests to hit your origin server, which means you lose the benefits of a CDN (at least for your document requests).
Fortunately, with the advent of edge computing, there are now some really good options that are free for most sites and relatively easy to configure yourself. I’ve spent the last few weeks learning how to use Cloudflare Workers to run A/B tests on this blog, and I wanted to share my setup and offer some tips for anyone else looking to do the same.
Basic concepts
I think there’s a perception in our industry that A/B testing is super complicated and you really need a tool or service to do it right. And while I’m sure some aspects of A/B are quite complex, the truth is that 90+% of the A/B tests most people want to run are actually pretty simple.
At its core, A/B testing consists of just three basic steps:
1) Randomly assign each user to an experiment group
There are a number of ways to do this step, but the easiest way is to randomly generate a number between 0 and 1 and store that value in a cookie so when the user returns or visits another page on your site, they’ll remain in the same group.
Then, based on the value of that random number, assign them to an experiment group. For example, if you want to deploy an experiment to 5% of your users, then users with a cookie value of less than 0.05 would get that version of the experiment.
The benefit of storing a number in the cookie rather than something like the experiment name is that if you want to gradually roll out an experiment to more users, it’s much easier to do so.
If you prefer not to use cookies, you can accomplish the same thing using service worker. Instead of the browser adding the cookie value to each request, the service worker can do it. In this post, however, I’ll focus on the cookie method because it’s easier and available to more people.
2) Serve the user a page matching their experiment group
For dynamic sites running a server, you can configure your server to read the cookie from the response header and then set a variable in your templates corresponding to the experiment group the user is in.
Your page templates might look something like this:
{% if EXPERIMENT === 'inline_css' %}
  <style>{{ 'path/to/main.css' | inline }}</style>
{% else %}
  <link rel="stylesheet" href="{{ 'path/to/main.css' }}>
{% endif %}
For static sites the process is a bit more complicated. You’ll need to build a different version of your site for each experiment group you have. This is what I do (more details below).
3) Report the user’s experiment group to your analytics service
The last step is to collect metrics as normal and report them to your analytics service. In addition, you’ll need to report what experiment group each user was in.
Most analytics and real-user monitoring (RUM) solutions support allow you to set a custom parameter or dimension value on the data you send, which allows you to then filter your reports to only users matching that custom value—similar to how you’d filter by standard dimensions like the user’s country, device type, or browser.
And that’s pretty much it! At a high-level it’s as simple as that to perform an A/B test.
Of course, the devil is always in the details, so let me get into the specifics of my implementation as well as share some real-world results (and some gotchas) from two experiments I’ve run recently.
Implementation details
Since my site is a static blog that I generate myself, in order to serve different experiment versions of my site, I need to actually build each of those versions separately and deploy them to my hosting provider.
When running any type of experiment it’s standard practice to have a control group that you can then use to compare against one or more treatment groups. To do this for my blog I run my build step once per experiment group—control and treatment(s)—and I set the environment variable EXPERIMENT to either null for the control group or a string representing the experiment name for each treatment group.
My build step outputs all files to a build directory, and I’ve configured it to output the control build to the root level of the build directory and each treatment group build goes into a subdirectory of build corresponding to the group name (prefixed with an underscore to prevent naming collisions).
For example, if I were running an experiment with a control group and two treatment groups named inline_css and preload_hero_image, the directory structure of my build output would look like this:
./build/*
./build/_inline_css/*
./build/_preload_hero_image/*
Within my templates I set the EXPERIMENT variable, so I can conditionally include/exclude certain content, for example:
{% if EXPERIMENT === 'inline_css' %}
  <style>{{ 'path/to/main.css' | inline }}</style>
{% else %}
  <link rel="stylesheet" href="{{ 'path/to/main.css' }}>
{% endif %}
I also pass theEXPERIMENT variable to my JavaScript bundle using Rollup via rollup-plugin-replace. Note that you will need to be able to reference the EXPERIMENT variable in your JavaScript code, so you can set it as a custom parameter on all the performance metrics you send to your analytics endpoint.
For example, if you’re sending performance data to Google Analytics, it might look like this:
import {getFCP} from 'web-vitals';

getFCP((metric) => {
  gtag('event', 'FCP', {
    value: metric.value,
    experiment: self.__EXPERIMENT,
  });
});
Note: as an alternative to passing the EXPERIMENT variable via your JavaScript bundler (which will require you to generate separate bundles per experiment) you can set it as a global variable via a <script> tag in your HTML templates. This is a good idea if you’re not testing any other JavaScript features and you don’t need your JS files to change between experiments. See more on this below in Tips and key learnings.
Once each version of my site has been built and deployed to my server, the next step was to create a Cloudflare worker that could serve different versions of my site to different users based on what experiment group they’re in.
If you’ve never used Cloudflare workers, you’ll probably want to read up on them first to better understand what I’m doing, but for a high-level overview, Cloudflare workers operate very similarly to service workers in that they act as a proxy between a user’s request and a server’s response. The worker can read the request and programmatically respond using whatever logic you give it.
The basic worker boilerplate looks like this.
addEventListener('fetch', (event) => {
  event.respondWith(handleRequest(event.request));
});

async function handleRequest(request) {
  // Update this line to change the response behavior.
  return fetch(request);
}
What I needed to do is update this code to respond as normal when the user is in the control group, or fetch files from one of my experiment group subdirectories (e.g. ./build/_inline_css/*) when the user is in one of those groups, respectively.
To get that working, the first step is reading the experiment ID value from the request cookie header, or generating a new one if no cookie value currently exists:
async function handleRequest(request) {
  const cookie = request.headers.get('cookie') || '';

  // Read the existing `xid` cookie value or randomly generate a new one.
  const xid = cookie.match(/(?:^|;) *xid=(\.\d+) *(?:;|$)/)
    ? RegExp.$1
    : `${Math.random()}`.slice(1, 5);

  // ...
}
The next step is to map the experiment ID and the request URL to the correct location on my origin server. The following logic returns either an empty experiment path (for the control group) or the path of an experiment subdirectory based on the passed xid value:
const experiments = {
  inline_css: [0, 0.33], // Match `xid` values between [0 and .33)
  preload_hero_image: [0.33, 0.67], // Match `xid` values between [.33 and .67)
};

function getExperimentPath(xid) {
  for (const [key, range] of Object.entries(experiments)) {
    const [lowerBound, upperBound] = range;
    if (xid >= lowerBound && xid < upperBound) {
      return '/_' + key;
    }
  }
  return '';
}
Lastly, I needed to actually make the request to my origin server and then pass that response on to the user with the experiment ID set on the cookie header:
async function handleRequest(request) {
  const cookie = request.headers.get('cookie') || '';

  // Read the existing `xid` cookie value or randomly generate a new one.
  const xid = cookie.match(/(?:^|;) *xid=(\.\d+) *(?:;|$)/)
    ? RegExp.$1
    : `${Math.random()}`.slice(1, 5);

  // Update the URL to include the experiment subdirectory, if applicable.
  const requestURL = new URL(request.url);
  const resourceURL = new URL(
    [
      requestURL.origin,
      getExperimentPath(xid),
      requestURL.pathname,
      requestURL.search,
    ].join('')
  );

  // Fetch the response from either Cloudflare's cache or the origin server.
  const response = await fetch(resourceURL, request);

  // Add the `xid` cookie to the response so future requests from
  // this user will remain in the current experiment group.
  const clone = new Response(response.body, response);
  clone.headers.set(
    'Set-Cookie',
    [
      'xid=' + xid,
      'Path=/',
      'Max-Age=31536000',
      'SameSite=Strict',
      'HttpOnly',
      'Secure',
    ].join('; ')
  );
}
The code in this last example is where the main magic happens. To make sure it’s clear what’s going on, let me walk you through it using an example:
- Imagine a new user navigates to the post
/articles/my-post-slug/on my site. Since they’re a new user, they won’t have any cookies set. - The logic above generates a random
xidvalue for them, say:.12345. - Since
.12345is less than.33, this user will be in theinline_cssexperiment group. - The request URL received by the Cloudflare worker’s
handleRequestfunction is/articles/my-post-slug/, but it will request the resource at/_inline_css/articles/my-post-slug/on my origin server. - Once the Cloudflare worker receives the response from my origin server, it will forward that response on to the user but with the
Set-Cookie: xid=.12345header added. - The user will receive the
inline_cssversion of this page, but the URL they see in their address bar will still show as the URL they originally requested (/articles/my-post-slug/. The fact that the worker requested a URL prefixed with/_inline_css/from my origin server is invisible to them. - All subsequent requests from this user will include the
xid=.12345cookie, so they’ll remain in theinline_cssexperiment for as long as I continue running it.
Note: this code is a slight simplification from the code I’m actually using on my blog. If you’re curious to see the full logic (which includes some unrelated things), check out my worker source on GitHub.
Testing and validating my setup
Once I’d configured my site to be able to run experiments, I was excited to try it out and see the results. But before I ran any “real” experiments, I wanted to test something to make sure that my A/B setup was actually working as expected.
To do that, I decided to create three experiment groups where I knew ahead of time what the results should be:
| Experiment | Description |
|---|---|
control | No changes to my site or serving logic. The Cloudflare worker intercepts the request, but it's a noop. |
unchanged | No changes to my site, but the Cloudflare worker runs its experiment-serving logic and the site is served from an /_unchanged/ subdirectory on my origin server. (This experiment is to validate that experiment-serving logic doesn't affect performance.) |
blocking_css | Everything about my site is the same as the control except instead of inlining my CSS in a <style> tag in my document <head>, I've switched to a render-blocking external CSS file, e.g. <link rel="stylesheet">. |
Given these three experiments, the results I expected to see were:
- No noticeable performance differences between
controlandunchanged - Slower FCP times for
blocking_cssdue to the added network latency that blocks rendering.
So I started the experiment and let it run for a few days. Here were the results:
| Experiment | FCP (p75) | Count |
|---|---|---|
control | 1312.2 | 605 |
unchanged | 1263.9 | 596 |
blocking_css | 1443.3 | 592 |
To be honest, I was a little unsure of what to make of those results. While the blocking_css experiment does show a worse FCP than the other two, I wasn’t expecting to see any FCP difference between control and unchanged, and certainly not a better FCP for unchanged (given that the only difference was more worker logic).
To try to understand whether this was just random variance, I created a visualization of the distribution curve for each of the three variants to see if that would provide any insight:
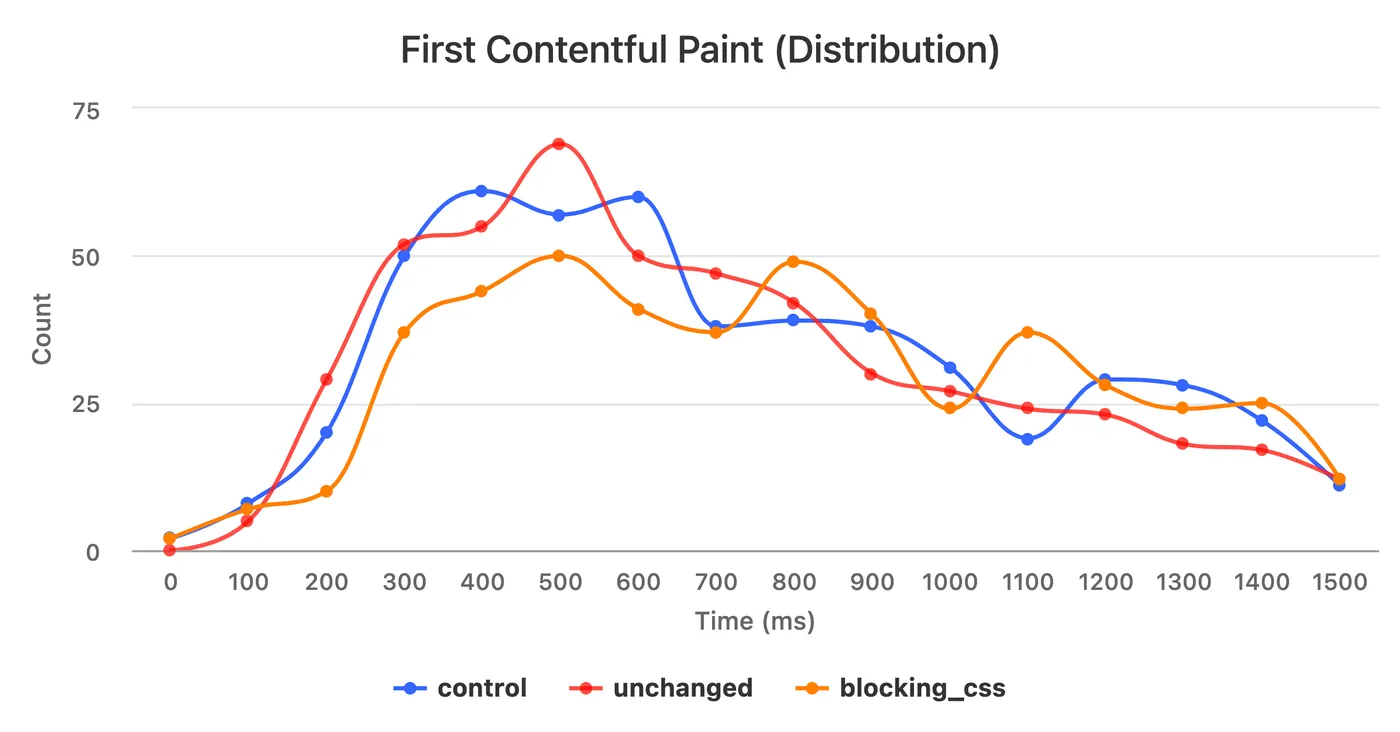
Once again, though, these distributions weren’t what I was expecting. The curves all have roughly the same shape, which didn’t make sense given that the use of blocking CSS should negatively impact paint times.
To figure out what was going on, I decided to add TTFB to the report to see if that could help explain the differences, given that all of these experiments were served from the same worker and origin server, I expected to see very similar TTFB values across all three variants:
| Experiment | TTFB (p75) | FCP (p75) | Count |
|---|---|---|---|
control | 992 | 1312.2 | 605 |
unchanged | 881.2 | 1263.9 | 596 |
blocking_css | 900.9 | 1443.3 | 592 |
Okay, now I really wasn’t sure what was going on. Why would the control variant have a worse TTFB than any of the other variants?
I assumed the explanation must be due to differences in the make-up of the groups, but given that I was assigning users to group randomly, I didn’t expect any differences to have this much of an effect.
Looking at the distribution of TTFB values reassured me a bit. The curves were more similar in shape than the FCP distributions, but I was still surprised to see so much variance at the 75th percentile.
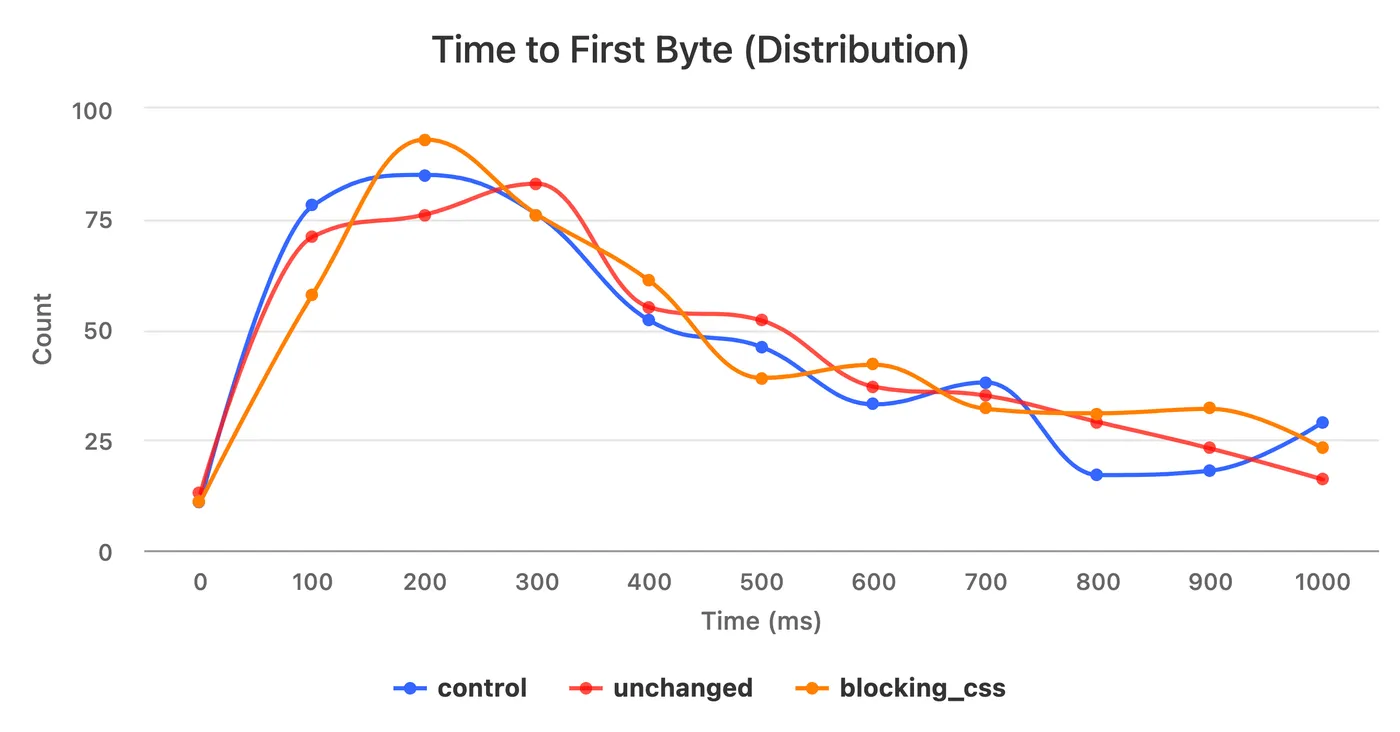
After thinking about it for a bit longer and looking deeper into the data, I realized the variance was most likely due to differences in cache hit rates across the three experiment variants. And this makes sense given that Cloudflare workers run in 250 different edge nodes, so a sample count of ~600 was probably not sufficiently large to get an evenly distributed cache hit rate across all three experiment groups.
This table shows my cache hit rates for each group:
| Experiment | Cache Hits | Count | Cache Hit % |
|---|---|---|---|
control | 67 | 605 | 11.07% |
unchanged | 16 | 596 | 2.68% |
blocking_css | 9 | 592 | 1.52% |
The control group has a much higher cache hit rate, which is most likely due to the fact that most of the URLs in my control group did not change and were likely already populated in many of Cloudflare’s edge cache nodes.
These differences in cache hit rates made me realize I would need to either normalize the data across the three experiment groups somehow, or I would have to compare a different metric that isn’t affected by cache hit rates. I chose to do the latter.
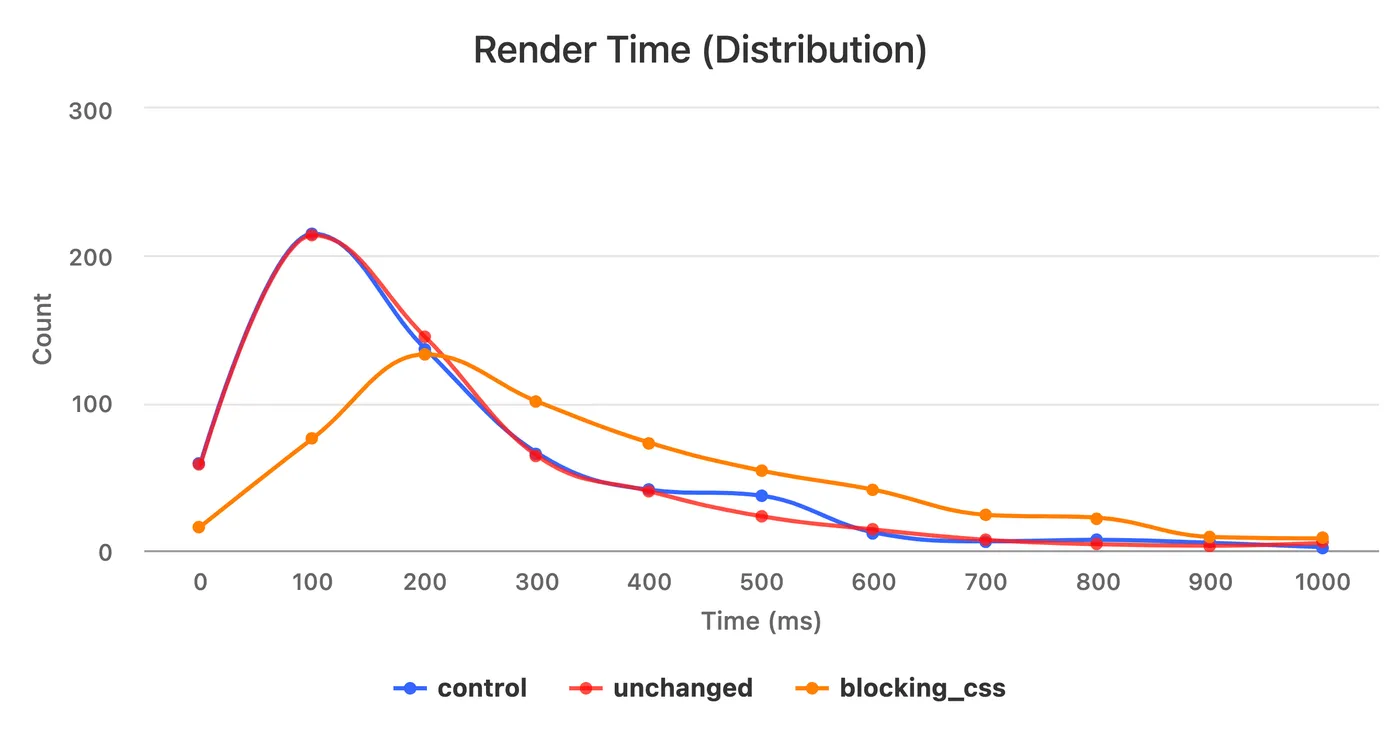
A CDN’s cache hit rate affects how quickly the browser receives content, but it doesn’t affect how quickly the browser can start rendering that content once it receives it, so if I only compare the time delta between the browser receiving the first byte of the response and the browser painting the first frame to the screen (let’s call this metric Render Time), then cache hit rate shouldn’t affect the results.
Here’s what the Render Time distribution looked like:
And the corresponding 75th percentile values:
| Experiment | Render Time (p75) | Count |
|---|---|---|
control | 364.3 | 605 |
unchanged | 340.2 | 596 |
blocking_css | 584.9 | 592 |
Ahh, much better! And much more inline with what I was expecting. The control and unchanged groups have almost identical distribution curves, and the blocking_css group is clearly skewed to the right. The 75th percentile values of the control and unchanged groups are also very similar and about 240 milliseconds faster than the blocking_css group.
Note: you might be wondering why the Render Time values and TTFB values don’t add up to the FCP value in the table above. The reason is that p75 Render Time equals p75(FCP - TTFB), which is not the same as p75(FCP) - p75(TTFB).
After looking at these results and being happy with what I saw, I showed them to a colleague with a statistics background because I wanted to ensure I wasn’t misinterpreting the data. He recommended I calculate confidence intervals for the 75th percentile values in each experiment group to see if there was overlap.
Here were those results for both the Render Time and FCP metrics:
| Experiment | Render Time (p75) | FCP (p75) | Count |
|---|---|---|---|
control | 364.3 (95% CI [324, 397.2]) | 1312.2 (95% CI [1218.4, 1373.9]) | 605 |
unchanged | 340.3 (95% CI [314.3, 377.1]) | 1263.9 (95% CI [1186.3, 1396.3]) | 596 |
blocking_css | 585.1 (95% CI [541.2, 628.8]) | 1443.3 (95% CI [1379, 1582.5]) | 592 |
And visualized, so it’s easier to see the overlap:
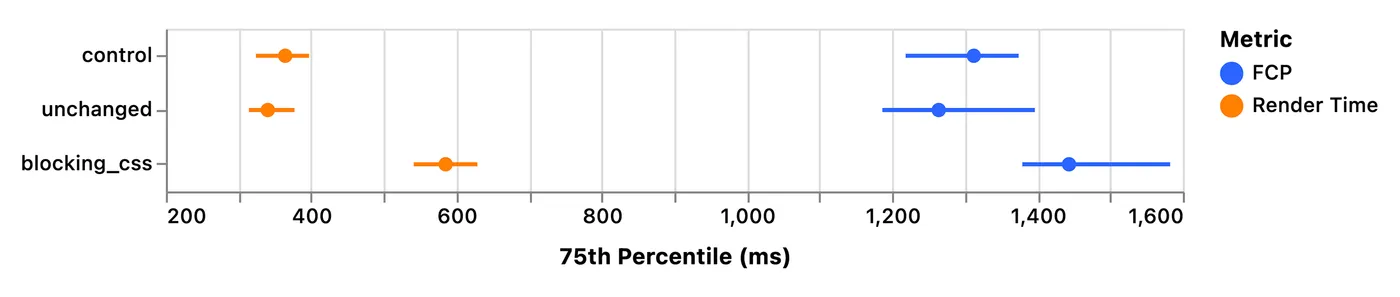
The chart above shows a small overlap in confidence intervals for FCP but no overlap at all for Render Time at the 75th percentile. This suggests that the use of blocking CSS in the document <head> was in fact the cause of the regression in Render Time, which confirmed my original hypothesis.
A real experiment
Now that I understood how to run an experiment and properly interpret the result, I decided to try and answer a question I’d been curious about for a long time.
As I mentioned above, on this blog I inline 100% of the CSS for the entire site in the head of each page, and the previous experiment shows that this method is indeed faster than linking to an external stylesheet.
My question, though, was: how much faster would my Render Time be if I reduced the total amount of CSS I was inlining?
I’ve never really spent much time optimizing the size of the CSS on my site, and I was pretty sure I could reduce the size substantially if I switched to CSS Grid and native CSS Custom Properties.
After a few hours modernizing my CSS, I was able to reduce the size from about 16K to less than 6K minified (not compressed since what I care about is parse and render times, not download times).
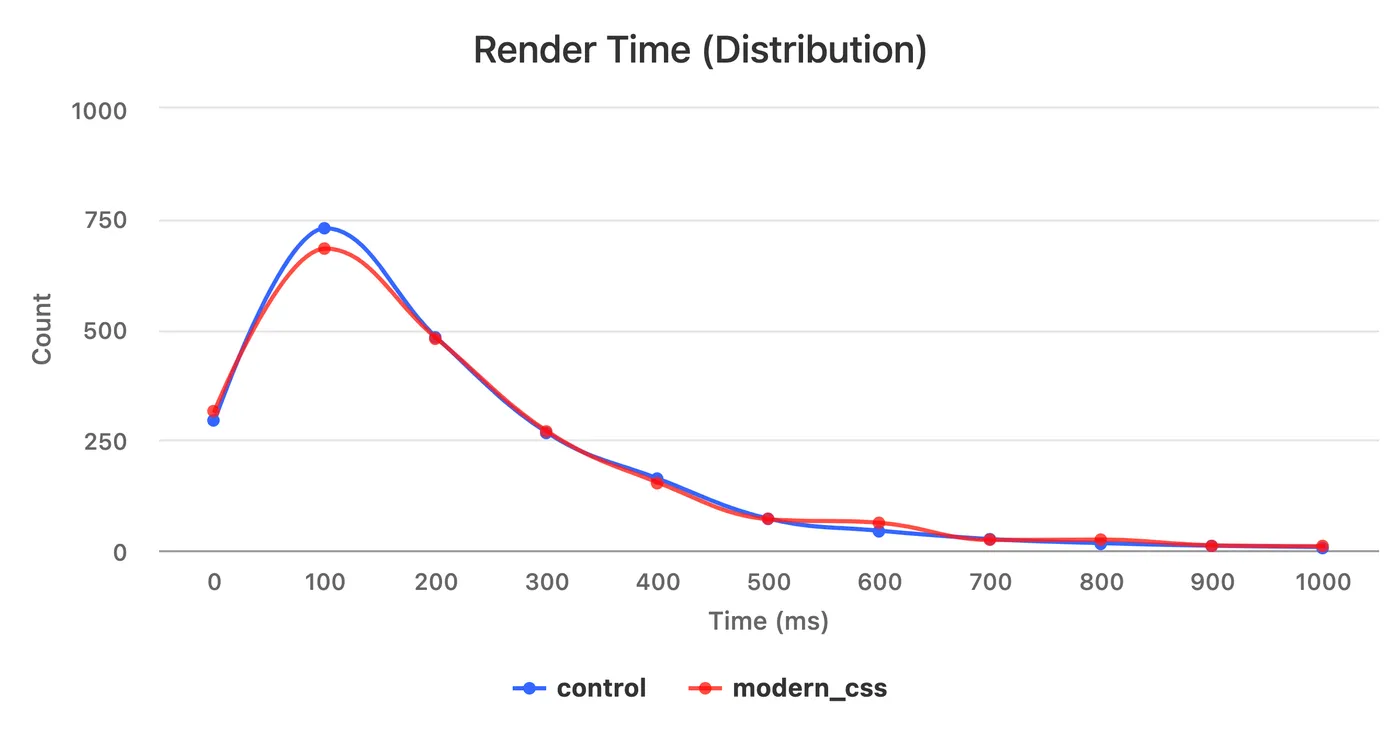
I set up an experiment to compare the current site to the version with the modernized CSS, and here were the results:
And the confidence intervals at the 75th percentile:
| experiment | Render Time (p75) | count |
|---|---|---|
control | 330.1 (95% CI [318.7, 346.1]) | 1709 |
modern_css | 344.8 (95% CI [332.5, 357]) | 1714 |
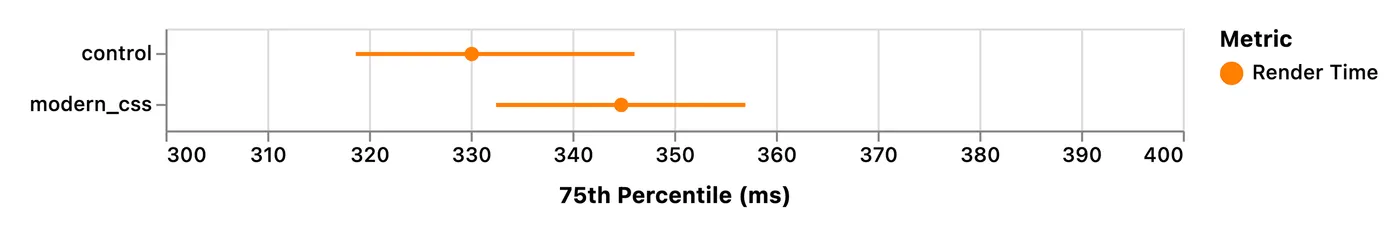
Whelp, turns out my efforts and hand-optimizations didn’t have a noticeable impact. These results show that there was no significant difference in Render Time between the control and modern_css experiment groups. The distribution curves are almost identical, and there’s a large overlap in the confidence intervals at the 75th percentile.
While I was kind of expecting a different outcome, I guess I’m not all that surprised. After all, I didn’t start with that much CSS (compare my original 16K to Bootstrap’s 156K minified).
The specific takeaway for me here is that the time it takes the browser to parse my styles and apply them to the page is not a bottleneck (for my specific site), and any further efforts to microtune my CSS probably won’t be noticeable to users.
Tips and key learnings
One important lesson I learned from this whole process is just how much CDN cache hit rates really do affect performance, and anything you do that reduces your hit rate will have a noticeable, negative impact.
Since A/B testing requires splitting up your users and serving them different resources, the act of A/B testing itself will lower your cache hit rate, and thus affect performance.
Again, for larger sites with lots of traffic, the difference may be negligible, but for smaller sites it’s probably wise to limit yourself to only two concurrent experiment groups, and only run experiments when knowing the results will be useful (and then turn them off when done).
Along those same lines, you should probably avoid creating completely separate sites for each experiment, since many of your static assets will likely not change from variant to variant. My rule of thumb is: any assets that you’re adding a content hash to the URL should be shared across variants, if the file’s contents are the same.
In other words, I do not have separate build/static/* and then build/_modern_css/static/* directories. I just have build/static, and all experiment variants reference that directory. This is safe because if the contents need to change from variant to variant, the hash will also change. If the contents do not change, then all variants can reference the same file on my origin server, so it won’t affect the cache hit rate.
Final thoughts and learnings
Based on my experience running a few different types of experiments, I’m now quite confident that this method of A/B testing is fast, reliable, and accurate—with the one caveat, of course, that you may have to control for some of the variables if your sample size is small like mine (which will be true for any experimentation methodology).
And now that I know how to properly A/B test features on my site, I plan to use this method to test any new performance improvements I make in the future—to verify that they actually achieve their expected outcome.
I’d love to hear from any readers who have tried this (or other) A/B testing techniques and learn about what worked and what didn’t. I mentioned at the beginning of this post that performant A/B testing is something I and many others have been chasing for a while now. I hope our tools evolve to make it even easier in the future so we can start making performance choices based on our own data rather than somebody else’s.