Google Analytics is a powerful yet quite complicated tool. And unfortunately, the truth is most people who use it don’t reap its full benefits.
There’s a lot of excellent and free content out there that explains how to use Google Analytics, but most of it is rather narrowly focused on use cases that primarily apply to marketers and advertisers; very little is geared toward web developers who simply want to better understand how people are using the sites they build.
For the past three years I’ve worked on Google Analytics (specifically on the web tracking side), and in that time I’ve learned far more than I ever thought I would. I’ve been able to dive deep into some of GA’s amazing features, and I’ve also run up against some of its annoying shortcomings.
This article is sort of a culmination of everything I’ve learned over the past three years, and it’s aimed specifically at web developers. Since this article is a bit on the long side, I’ve broken it up into several distinct topics, so you can read it in parts and more easily reference something later.
- Loading analytics.js
- Tracking custom data
- Error tracking
- Performance tracking
- Using autotrack plugins
- Testing your implementation
- Filtering out local/spam data
- Reporting and visualizing your data
I’ve also created the analyticsjs-boilerplate repo on Github as a complement to this article. It includes all the code I mention here as well as a working example showing how all the pieces fit together. If you’re one of the many web developers out there who just copy/pastes the default tracking snippet and calls it a day, I highly recommend using this boilerplate instead.
Loading analytics.js
In my opinion, it’s never acceptable for analytics to degrade the user experience of a site. In other words, tracking scripts should always be loaded asynchronously (this includes libraries like analytics.js as well as your own tracking code), and the data you send to analytics services should never interfere with other network requests needed for your site.
The async tracking snippet is the current, officially recommended way to load analytics.js on modern websites, and for the most part it works great. The goal of this snippet is to ensure analytics.js is loaded as soon as possible but also asynchronously so it doesn’t block the loading of other critical resources.
While the current tracking snippet is good, it can definitely be better. One problem with the async tracking snippet is, by default, it will still create two HTTP requests (one for the analytics.js script and one to send the initial pageview) that will push back the load event, which will affect other load-based metrics and potentially delay code scheduled to run after the window loads.
There are two ways to solve this problem, the first is to wait until after the load event fires to run the tracking code, but this is undesirable since it will potentially result in missed pageviews from users who bounce early.
The second option is to use the beacon transport mechanism to send all hits, which uses navigator.sendBeacon() under the hood. Since hits sent with sendBeacon() don’t affect loading (or unloading) of the current page, it has the best of both worlds.
Here’s what the modified snippet looks like when using the beacon transport mechanism. Note the addition of the set command specifying 'transport', 'beacon', which tells the tracker to use navigator.sendBeacon() for all subsequent hits:
<script>
  window.ga=window.ga||function(){(ga.q=ga.q||[]).push(arguments)};
  ga('create', 'UA-XXXXX-Y', 'auto');
  ga('set', 'transport', 'beacon');
  ga('send', 'pageview');
</script>
<script async src="https://www.google-analytics.com/analytics.js"></script>
Putting your tracking code in a separate file
The default tracking snippet instructions recommend adding the snippet code to the <head> of all pages on your site. If you’re just using the snippet as is, that’s probably fine, but as we add more code to track additional user interactions (which we will throughout this post), keeping all that code in the <head> is a bad idea.
I prefer to put all my analytics-related code in a separate file that I load asynchronously after my other site code has finished loading.
If you use a build tool that supports code splitting (like Webpack), you can lazily initialize your tracking code from your script’s main entry point like this:
// index.js

const main = () => {
  // Load custom tracking code lazily, so it's non-blocking.
  import('./analytics/base.js').then((analytics) => analytics.init());

  // Initiate all other code paths here...
};

// Start the app through its main entry point.
main();
Your custom tracking code will then live in its own module and can be initialized via its exported init() function:
// analytics/base.js

export const init = () => {
  // Initialize the command queue in case analytics.js hasn't loaded yet.
  window.ga = window.ga || ((...args) => (ga.q = ga.q || []).push(args));

  ga('create', 'UA-XXXXX-Y', 'auto');
  ga('set', 'transport', 'beacon');
  ga('send', 'pageview');
};
Now your template files only includes the <script async> tag to load analytics.js as well as your site’s regular JavaScript code:
<!-- Loads the site's main script -->
<script src="path/to/index.js"></script>

<!-- Loads analytics.js asynchronously -->
<script async src="https://www.google-analytics.com/analytics.js"></script>
Note that if you’re not using a build system with code splitting features, you can get the same effect by compiling your tracking code separately and loading it via <script async> just like you do with analytics.js.[1] Also note that you don’t have to worry about load order; analytics.js is specifically designed to handle cases where it loads first, last, or not at all (e.g. in cases where its blocked by an extension):
<!-- Loads the site's main script -->
<script src="path/to/index.js"></script>

<!-- Loads analytics.js and custom tracking code asynchronously -->
<script async src="https://www.google-analytics.com/analytics.js"></script>
<script async src="/path/to/tracking-code-bundle.js"></script>
Tracking custom data
A dimension in Google Analytics is a way to subdivide your usage data into categories. For example, some built-in dimensions available to you in reports are Browser, Device Category, Language, Page, etc.
While the built-in dimensions are great, there are many dimensions that would be incredibly useful that are not tracked by analytics.js. Luckily, Google Analytics has a feature called custom dimensions, so you can implement and track whatever dimensions you want.
In the rest of this section I’ll list the custom dimensions I track on every site and explain why I use them.
Tracking Version
Any time you make changes to software it’s important to version your changes so you can isolate a specific feature set to a specific version number. This is as true with analytics implementations as it is with anything else.
If you update your analytics implementation to start tracking a bunch of new dimensions, or if you change the format of the data you’re collecting (for whatever reason), you probably only want to report on data from the subset of users who are running your latest changes.
The easiest way to do this in Google Analytics is to create a custom dimension called Tracking Version, and set its scope to “Hit” (since it will apply to all hits).
In analytics.js you refer to a custom dimension by its index, but I think that gets confusing pretty quickly after you’ve created a few custom dimensions (which we will), so I always create an object that maps custom dimension names to their index.
const dimensions = {
  TRACKING_VERSION: 'dimension1',
};
Now, if you set this custom dimension value on the tracker, it will send that value with all future hits. If this is your first tracking version, set it to '1'.
const TRACKING_VERSION = '1';

ga('create', 'UA-XXXXX-Y', 'auto');
ga('set', 'transport', 'beacon');
ga('set', dimensions.TRACKING_VERSION, TRACKING_VERSION);
ga('send', 'pageview');
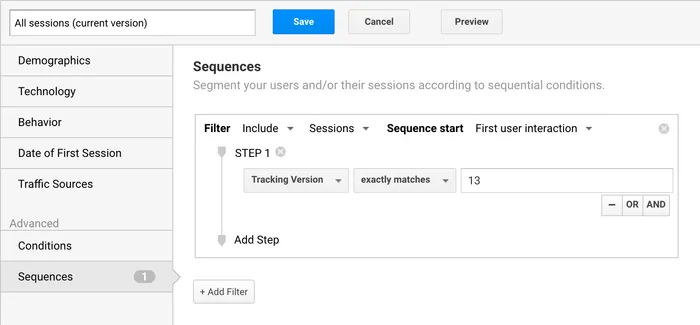
With this new dimension, any time you make a breaking change to your tracking implementation you can increment the version number. Then, at reporting time, you can segment your reports to only include sessions from users where the first hit contains the matching tracking version.
Here’s what the segment definition I use looks like (as you can see, I’m on version 13):
Client ID
Google Analytics uses a client ID to associate individual hits with a particular user. Unless you’ve customized your setup, analytics.js automatically generates this value for you, stores it in the browser’s cookies, and sends it with all hits.
Google Analytics uses this client ID internally, but doesn’t make it available to you in reports.
Luckily, (as you’ve probably guessed) you can work around this limitation by creating a custom dimension called Client ID, setting its scope to “User”, and assigning it the same value as the native client ID created by analytics.js.
To understand why this is useful, consider the following scenario: let’s say you notice some click events in your reports on a page where the button being clicked isn’t supposed to be visible. So you ask yourself: how is it possible my site got into this broken state?
With access to the Client ID dimension, you can debug this problem by picking any of the users who got into that bad state and then creating a report to see only the interactions of that user (by filtering to only include hits matching that user’s client ID).
Without this Client ID dimension you can only report on users in aggregate, which has obvious limitations.
To get the client ID value created by analytics.js in your tracking code, you invoke the get() method to read the value stored on the tracker. Then you can invoke the set() method to assign that value to your newly created custom dimension:
const dimensions = {
  TRACKING_VERSION: 'dimension1',
  CLIENT_ID: 'dimension2',
};

// ...

ga((tracker) => {
  var clientId = tracker.get('clientId');
  tracker.set(dimensions.CLIENT_ID, clientId);
});
This code works by passing a function to the ga() command queue, which will be invoked with the default tracker object as soon as analytics.js is loaded.
Window ID
Sometimes users interact with your site with more than one window or tab open at a time. Google Analytics doesn’t currently collect window/tab-specific data, but you can if you create another custom dimension called Window ID, set its scope to “Hit”, and assign it a random value at page load time. That way every hit sent from the current window context can be later associated with that window context through the Window ID dimension.
This is particularly useful for single page apps where a user can have many pageviews without ever doing a full page reload.
To create a unique value, you’ll have to include a function to generate it. I like this uuid() function because it’s very short, but you can use whatever function you like:
const uuid = function b(a) {
  return a
    ? (a ^ ((Math.random() * 16) >> (a / 4))).toString(16)
    : ([1e7] + -1e3 + -4e3 + -8e3 + -1e11).replace(/[018]/g, b);
};
Then set the Window ID value on your tracker object before you send any data to Google Analytics:
const dimensions = {
  TRACKING_VERSION: 'dimension1',
  CLIENT_ID: 'dimension2',
  WINDOW_ID: 'dimension3',
};

export const init = () => {
  // ...
  ga('set', dimensions.WINDOW_ID, uuid());
  // ...
};
Hit ID, time, and type
The Google Analytics interface lets you easily report on aggregate data, but if you want to get access to individual user, session, or hit-level data, you’re mostly out of luck.
There is a feature called BigQuery Export that allows you to export all your data (which gives you hit-level granularity), but it’s only available to premium customers, so the vast majority of users won’t have access to it.
Luckily, with a few more custom dimensions you can get most of the way there. The trick is to add unique, hit-specific metadata to every hit that gets sent to Google. Then, at reporting time, you just specify these hit-level dimensions and voila! You can isolate individual hits in your reports.
I mentioned previously that tracking Client ID via a custom dimension is immensely useful when debugging unexpected user-interaction data. These hit-level custom dimensions make that even easier as they allow you to drill down into individual user interactions (anonymously of course), and see everything these users are doing, when, and in what order they’re doing it. Ultimately allowing you to make your site better for everyone.
To track the Hit ID, Hit Time, and Hit Type custom dimensions, first create them in Google Analytics and set their scope to “Hit”. Then, in your tracking code, override the buildHitTask and set these values on the model, thus ensuring they’re applied to every hit:
const dimensions = {
  // ...
  HIT_ID: 'dimension4',
  HIT_TIME: 'dimension5',
  HIT_TYPE: 'dimension6',
};

export const init = () => {
  // ...
  ga((tracker) => {
    const originalBuildHitTask = tracker.get('buildHitTask');
    tracker.set('buildHitTask', (model) => {
      model.set(dimensions.HIT_ID, uuid(), true);
      model.set(dimensions.HIT_TIME, String(+new Date), true);
      model.set(dimensions.HIT_TYPE, model.get('hitType'), true);

      originalBuildHitTask(model);
    });
  });
  // ...
};
The Hit ID dimension is set to the result of calling our uuid() function (like we did with Window ID), the Hit Time dimension is set to the current timestamp, and the Hit Type dimension is set to the value already stored on the tracker (which, like with client ID, is tracked by GA but not made available in reports):
Error tracking
Do you know for sure if your code is running as intended (and without error) for every user who visits your site? Even if you do comprehensive cross-browser/device testing prior to releasing your code, there’s still the possibility that something went wrong or that some browser/device combination you didn’t test will fail.
There are paid services like Track:js and Rollbar that do this for you, but you can get a lot of the way there for free with just Google Analytics.
I track unhandled errors by adding a global error event listener as the very first <script> in the <head> of the page. It’s important to add this first, so it catches all errors:
<script>addEventListener('error', window.__e=function f(e){f.q=f.q||[];f.q.push(e)});</script>
This code stores any unhandled errors in an array on the listener function itself. Then, once the rest of the analytics code has loaded, you can report on these errors with the following functions:
export const init = () => {
  // ...
  trackErrors();
  // ...
};

export const trackError = (error, fieldsObj = {}) => {
  ga('send', 'event', Object.assign({
    eventCategory: 'Script',
    eventAction: 'error',
    eventLabel: (error && error.stack) || '(not set)',
    nonInteraction: true,
  }, fieldsObj));
};

const trackErrors = () => {
  const loadErrorEvents = window.__e && window.__e.q || [];
  const fieldsObj = {eventAction: 'uncaught error'};

  // Replay any stored load error events.
  for (let event of loadErrorEvents) {
    trackError(event.error, fieldsObj);
  }

  // Add a new listener to track event immediately.
  window.addEventListener('error', (event) => {
    trackError(event.error, fieldsObj);
  });
};
Note: the nonInteraction field is set to true to prevent this event from influencing bounce rate calculations. If you’re curious as to why this is important you should read more about non-interaction events.
The above logic loops through each stored error on the error event listener and reports it. It then adds a new listener to immediately send uncaught errors to Google Analytics as they occur.
Note: you can use a similar strategy to track unhandled Promise rejections via the unhandledrejection event, but that gets a bit more complicated since a Promise rejection can be initially unhandled but then handled later. For simplicity, it’s not included it in this post, but you’ll probably want to add it to your error tracking implementation if you want full coverage.
Exception hits vs events
Experienced Google Analytics users might be wondering why I’m sending these errors as event hits rather than exception hits (a feature which was added to Google Analytics specifically for this purpose).
The simple reason is that exceptions hits do not show up in the Real Time report and event hits do. It’s a shame because, of all the hit types that you’d want to know about in real time, exception hits are clearly at the top of that list.
Performance Tracking
Several years ago Google Analytics introduced Site Speed tracking, allowing you to report on most of the metrics in the Navigation Timing API. This was a great initial step, but unfortunately (as with the exception hit type) it has too many limitations to be useful. If you really care about these metrics, you’ll probably want to track them yourself.
The Site Speed feature works because analytics.js automatically sends a timing hit on page load for 1% of your users. The problem is 1% is not a particularly representative sample for most sites, and there’s no way to increase this limit because the sampling is enforced on both the client and the server at processing time.
The other problem is timing hits aren’t available in segments, which means you can’t run a report—for example—that only includes users whose pageload took longer than 10 seconds.
Custom metrics (similar to custom dimensions) do not have either of these limitations, so that’s what I use to do all my performance tracking.
Custom performance metrics
To see how to track performance via custom metrics, consider three of the more commonly referenced performance metrics from the Navigation Timing API that can be used to measure the critical rendering path:
- responseEnd: the point when the server finishes delivering the response to the browser.
- domContentLoadedEventStart: when all the page’s content is processed and loaded in the DOM, and the browser can start rendering the page.
- loadEventStart: when all the page’s initial resources are loaded.
Once you’ve created the above three custom metrics in Google Analytics (and set their scope to “Hit” and their formatting type to “Integer”), you can use this code to track them:
const metrics = {
  RESPONSE_END_TIME: 'metric1',
  DOM_LOAD_TIME: 'metric2',
  WINDOW_LOAD_TIME: 'metric3',
};

export const init = () => {
  // …
  sendNavigationTimingMetrics();
};

const sendNavigationTimingMetrics = () => {
  // Only track performance in supporting browsers.
  if (!(window.performance && window.performance.timing)) return;

  // If the window hasn't loaded, run this function after the `load` event.
  if (document.readyState != 'complete') {
    window.addEventListener('load', sendNavigationTimingMetrics);
    return;
  }

  const nt = performance.timing;
  const navStart = nt.navigationStart;

  const responseEnd = Math.round(nt.responseEnd - navStart);
  const domLoaded = Math.round(nt.domContentLoadedEventStart - navStart);
  const windowLoaded = Math.round(nt.loadEventStart - navStart);

  // In some edge cases browsers return very obviously incorrect NT values,
  // e.g. 0, negative, or future times. This validates values before sending.
  const allValuesAreValid = (...values) => {
    return values.every((value) => value > 0 && value < 1e6);
  };

  if (allValuesAreValid(responseEnd, domLoaded, windowLoaded)) {
    ga('send', 'event', {
      eventCategory: 'Navigation Timing',
      eventAction: 'track',
      nonInteraction: true,
      [metrics.RESPONSE_END_TIME]: responseEnd,
      [metrics.DOM_LOAD_TIME]: domLoaded,
      [metrics.WINDOW_LOAD_TIME]: windowLoaded,
    });
  }
};
Now you can get the average load time values by dividing the totals for Response End Time, DOM Load Time, and Window Load Time by the metric Total Events.
Median vs. average
I’m sure many of you read that last sentence and thought: I don’t want to know the average, I want to know the median!
Not having median values is a common criticism of Google Analytics, and for good reason. But if you’ve implemented the hit-level custom dimensions I suggested above, you’ll be able to calculate median values yourself because you’ll have hit-level granularity. More on this in the reporting section below.
Using autotrack plugins
I’m obviously a bit biased here since I created the autotrack library, but it’s probably worth pointing out that the main reason I did is because I found myself reimplementing the same features, over and over again, on every site I built.
Since I was doing this, I knew others probably were too, and it seemed crazy to me that there wasn’t a more official way to track the things that basically everyone wants to track.
I won’t go into too much detail here because you can read all about what these plugins do in the autotrack documentation, but I wanted to briefly mention the plugins I use on pretty much every site:
A must have since Google Analytics doesn’t track navigations to external domains.
Hate seeing a bunch of marketing params in the URLs of your page reports? Yeah, me too. This plugin solves that problem in a developer-friendly way (as opposed to having to use view filters).
Tracking how far down the page a user scrolls is actually a fairly complex problem. It’s also pretty easy to accidently cripple your user’s scroll experience when not done right. This plugin handles all of these complications for you.
Session duration in Google Analytics is actually a very broken metric. It doesn’t track the time spent on the final page of a session (meaning single-page visits have a session duration of 0), and it doesn’t account for time when the page was open but in a background tab. Using page visibility is a much better and more accurate way of tracking how long a user was active on your site.
Obviously not every site is a single page application. But if yours is, it’s far easier to include this plugin than it is to try to track dynamic pageviews manually.
Testing your implementation
When creating autotrack, I did a ton of experimentation and testing on these plugins before releasing them publicly. Anytime you implement tracking for a new feature on your site, you run the risk of getting something wrong, and since Google Analytics doesn’t let you modify or revise your data after sending it, the price of getting it wrong can be high.
To deal with this, I almost always use at least two trackers on my site. One that sends data to my production property, and one that sends data to my test property.
My test tracker is used to send experimental data—implementations I’m testing to ensure they work as expected. I only start tracking a feature with my production tracker once I’m confident its correct.
I’ve included a multiple-trackers example in analyticsjs-boilerplate, but you can get the basic gist of how it works from the code below. Essentially, you give each tracker a distinct name (and tracking ID), and then you prepend all commands with the corresponding name:
ga('create', 'UA-XXXXX-Y', 'auto', 'prod');
ga('create', 'UA-XXXXX-Z', 'auto', 'test');

ga('prod.send', 'pageview');
ga('test.send', 'pageview');
Filtering out local/spam data
Sometimes spammers will send fake data to your Google Analytics account to promote their shady businesses. If you don’t believe me, just search for “Google Analytics spam”, and you find plenty of people complaining the problem and suggesting fixes.
However, sometimes the bad data being sent is your own fault—perhaps you ran your entire test suite but forgot to disable analytics.js in your CI environment.
There’s a simple solution to both of these problems, and that’s to use View Filters. I use the following two filters on all my sites:
- A hostname filter (e.g. only URL hostnames matching
philipwalton.com) - A RegExp match filter for a custom dimension value specific to my site (e.g. Tracking Version or Hit ID)
In order for a hit to be processed by Google Analytics, it has to pass all view filters. Since hits sent while running your site locally (or on a staging server) won’t match the hostname, they won’t show up. And even if a spammer were savvy enough to send hits matching the hostname, it’s incredibly unlikely that they’d also match one of your custom dimensions.
In my experience these two filters have been 100% effective at keeping unwanted data out.
Reporting and visualizing your data
If you’ve followed all the techniques in this post or implemented analyticsjs-boilerplate on your site, the most important piece of advice I can give you for reporting on your data is to learn these features: custom reports, calculated metrics, and the Analytics Reporting API.
Custom reports
The standard reports in Google Analytics are useful, but if you’ve done anything custom (e.g. created custom dimensions or custom metrics), then you need to use custom reports to access and visualize that data.
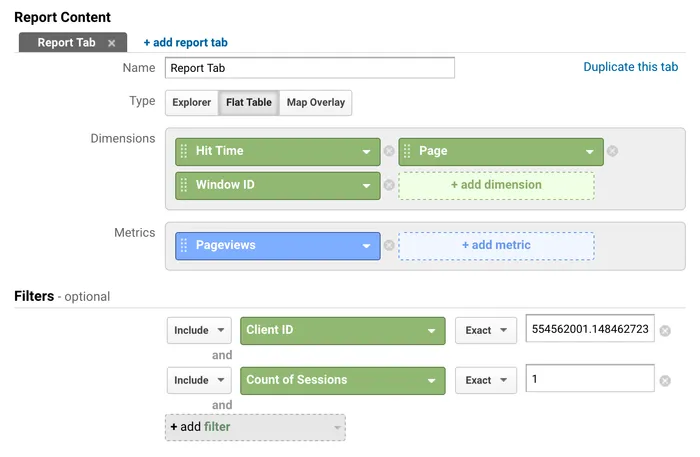
For example, in the section on tracking custom data I mentioned isolating individual users with the Client ID dimension and individual page loads with the Window ID dimension. Here’s a report listing all the pageviews (in Hit Time order) from a particular user’s first session, showing both Page and Window ID.

As you can see from the above report, this user started their session by reading an article and then navigated to the home page (in the same window). They then opened up four new articles, all in different windows. While this data isn’t particularly interesting, it should give you an idea of just how much more detail you can get by implementing the custom dimensions above.
To create this report I picked a random client ID and session from one of my other reports (I chose a session that contained multiple unique pageviews to make it more interesting). Then I created a custom report that filtered only hits matching that Client ID and Session Count dimension:
Calculated metrics
Calculated metrics allow you to define new metrics that can be derived from existing metrics.
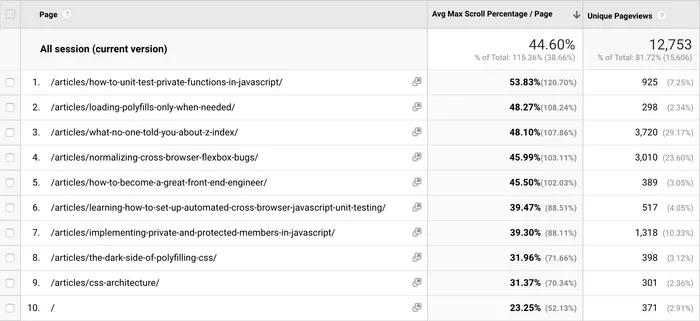
For example, the autotrack maxScrollTracker plugin tracks the maximum scroll percentage for each page in a given session. However, since Google Analytics only reports metric totals across all sessions in a report’s date range, this value isn’t particularly useful on its own.
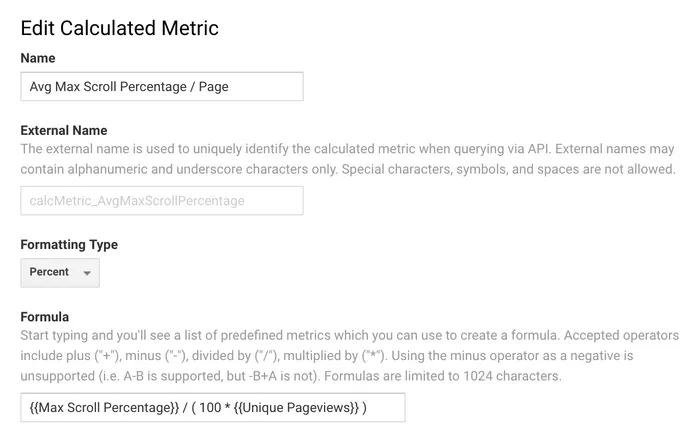
However, when you create a calculated metric to compute the average Max Scroll Depth value per unique pageviews in a session, you suddenly have a very useful metric.
Here’s a screenshot of a custom report I created showing pages with the highest average max scroll percentage on this site over the past 7 days.
And the following screenshot shows how this calculated metric is configured:
Medians, histograms, and distributions
I mentioned above that you can use the hit-level custom dimensions to calculate medians and other distribution data.
As an example of why distribution data is useful, consider the max scroll report above. While the averages shown there are a good way to compare one dimension to another, they don’t show the complete picture of how users typically scroll on my site.
The histogram below shows a distribution of max scroll percentage (per session) across all users who scrolled over the past few days. The median value was 80%.
Tip: to get median values in Google Analytics, all you have to do is add the Hit ID dimension to your report, sort the metric values in ascending order, and then read the middle value.
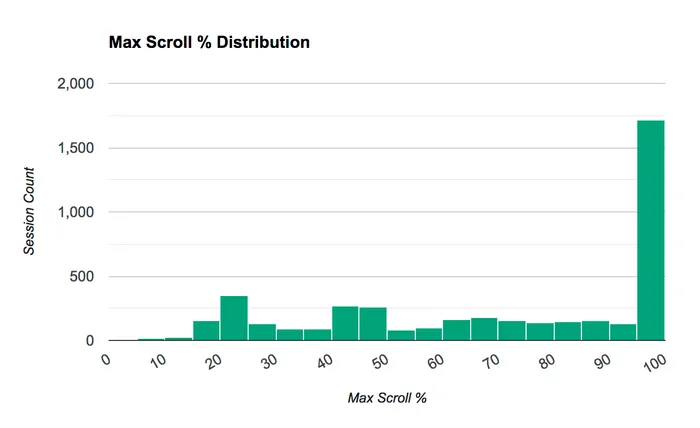
As you can see from this chart, the largest bucket by far is users who scrolled all the way to the bottom of the page. This chart tells a vastly different story from the 44.60% average number in the previous report, and it emphasizes the value in having hit-level reporting granularity.
To create histograms like the one above you’ll need to use the Analytics Reporting API to fetch the data and then a visualization library (the example above uses Google Charts) to create the chart, so it’s a bit more complicated than just using the Google Analytics UI, but for more advanced reporting needs, it’s definitely worth investing in learning these tools to get the most out of your data.
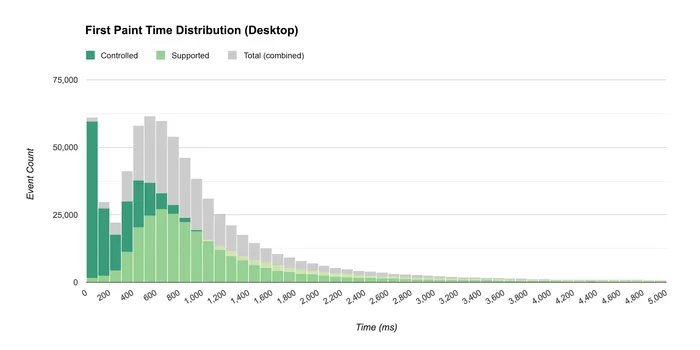
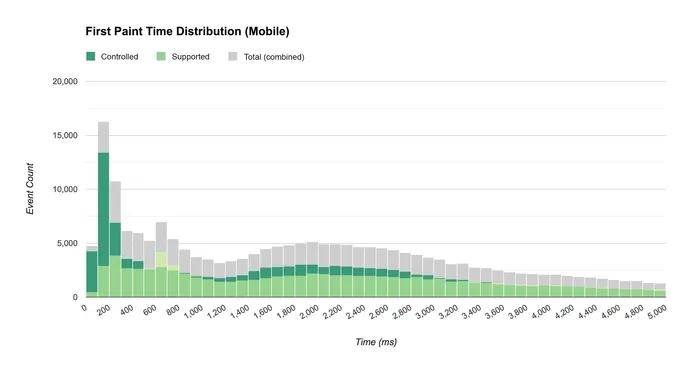
Another good example of visualizing hit-level metric distribution is the performance data we measured in last year’s Google I/O webapp. We created a custom dimension that indicated whether or not the browser was loading the page via a Service Worker, and we created a metric to track time to first paint. From this data we were able to see how service worker usage impacts load times across desktop and mobile.
On desktop the median time to first paint was 583 ms when controlled by a service worker vs. 912 ms when not controlled.
On mobile the median was 1634 ms when controlled by a service worker vs. 1933 ms when not controlled.
Conclusions
There are a lot of features developers would like that Google Analytics doesn’t track by default. However, with only a bit of configuration and extra code, you can do almost everything you want with Google Analytics’ existing extensibility features today.
This article provides a brief introduction into my rationale for including a lot of these features in my “boilerplate” analytics.js implementation. If you want to keep up to date with the current state of best practices, you should follow the analyticsjs-boilerplate repo on Github. I plan to keep it updated as new tracking techniques and best practices emerge.